Measure
STDF Analytics
Open a lot and read what it did: yield by site and bin, Cpk with a histogram for every parametric test, first-fail and test-time paretos, an outlier screen for passing parts that sit outside the population, limit drift against the spec and the program, trends across lots and wafer maps. Then turn the statistics into limit proposals you review — ATE·IQ never writes them into the program. The lots shown on this page are demonstration data: seeded synthetic lots with defects planted on purpose.
Overview
Upload an STDF file or sync a repository and it is read natively on the engineer's machine — plain or gzipped, no external parser. Every analysis is deterministic: same file, same answer, and the lot page, the traceability dashboard and the IG-XL agent's tools read the same results.
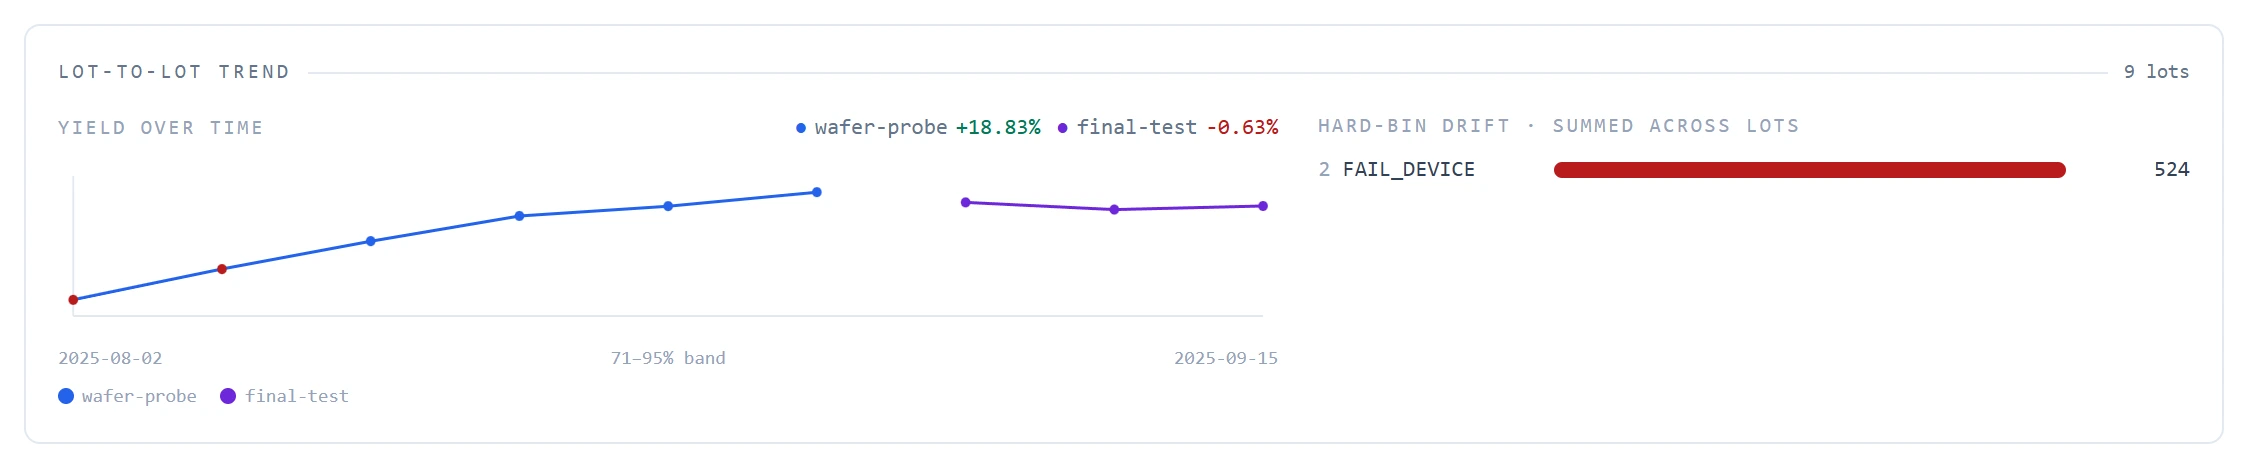
Start at the library. A lot-to-lot yield trend and a hard-bin drift strip summed across lots show a program slowly losing yield before anyone opens a single lot. Open a lot and the full working view is one click away.
The analyses
| Analysis | What it gives you |
|---|---|
| Yield by site and bin | Overall and per-site yield, hard- and soft-bin paretos, and the lot's device, tester and program identity, from the MIR and PCR records. |
| Parametric statistics | Mean, standard deviation, Cp and Cpk per test, with an inline histogram of its results — from PTR and MPR records, so multi-pin parametric tests are counted rather than left out of the grid. |
| First-fail pareto | For every failed part, the test that failed first. The top entry is the test gating the most parts. |
| Test-time pareto | Tests ranked by their share of the lot's test time. A test that never fails but takes a large share is marked as a candidate to speed up — never to skip. |
| Functional fails | The fail table for pattern-based tests, from FTR records. |
| Outlier screen | Dynamic-PAT robust limits estimated from the population itself. Flags parts that pass the program's limits but sit outside the population. Below 30 samples it reports insufficient data — never a reassuring “0 outliers”. |
| Limit drift | The limits the lot actually ran, against the spec and the program as it stands now — joined on test number, with units reconciled, so historical drift is reported as drift. |
| Cross-lot trends | One test followed across lots, alongside the library's lot-to-lot yield and hard-bin drift strips. |
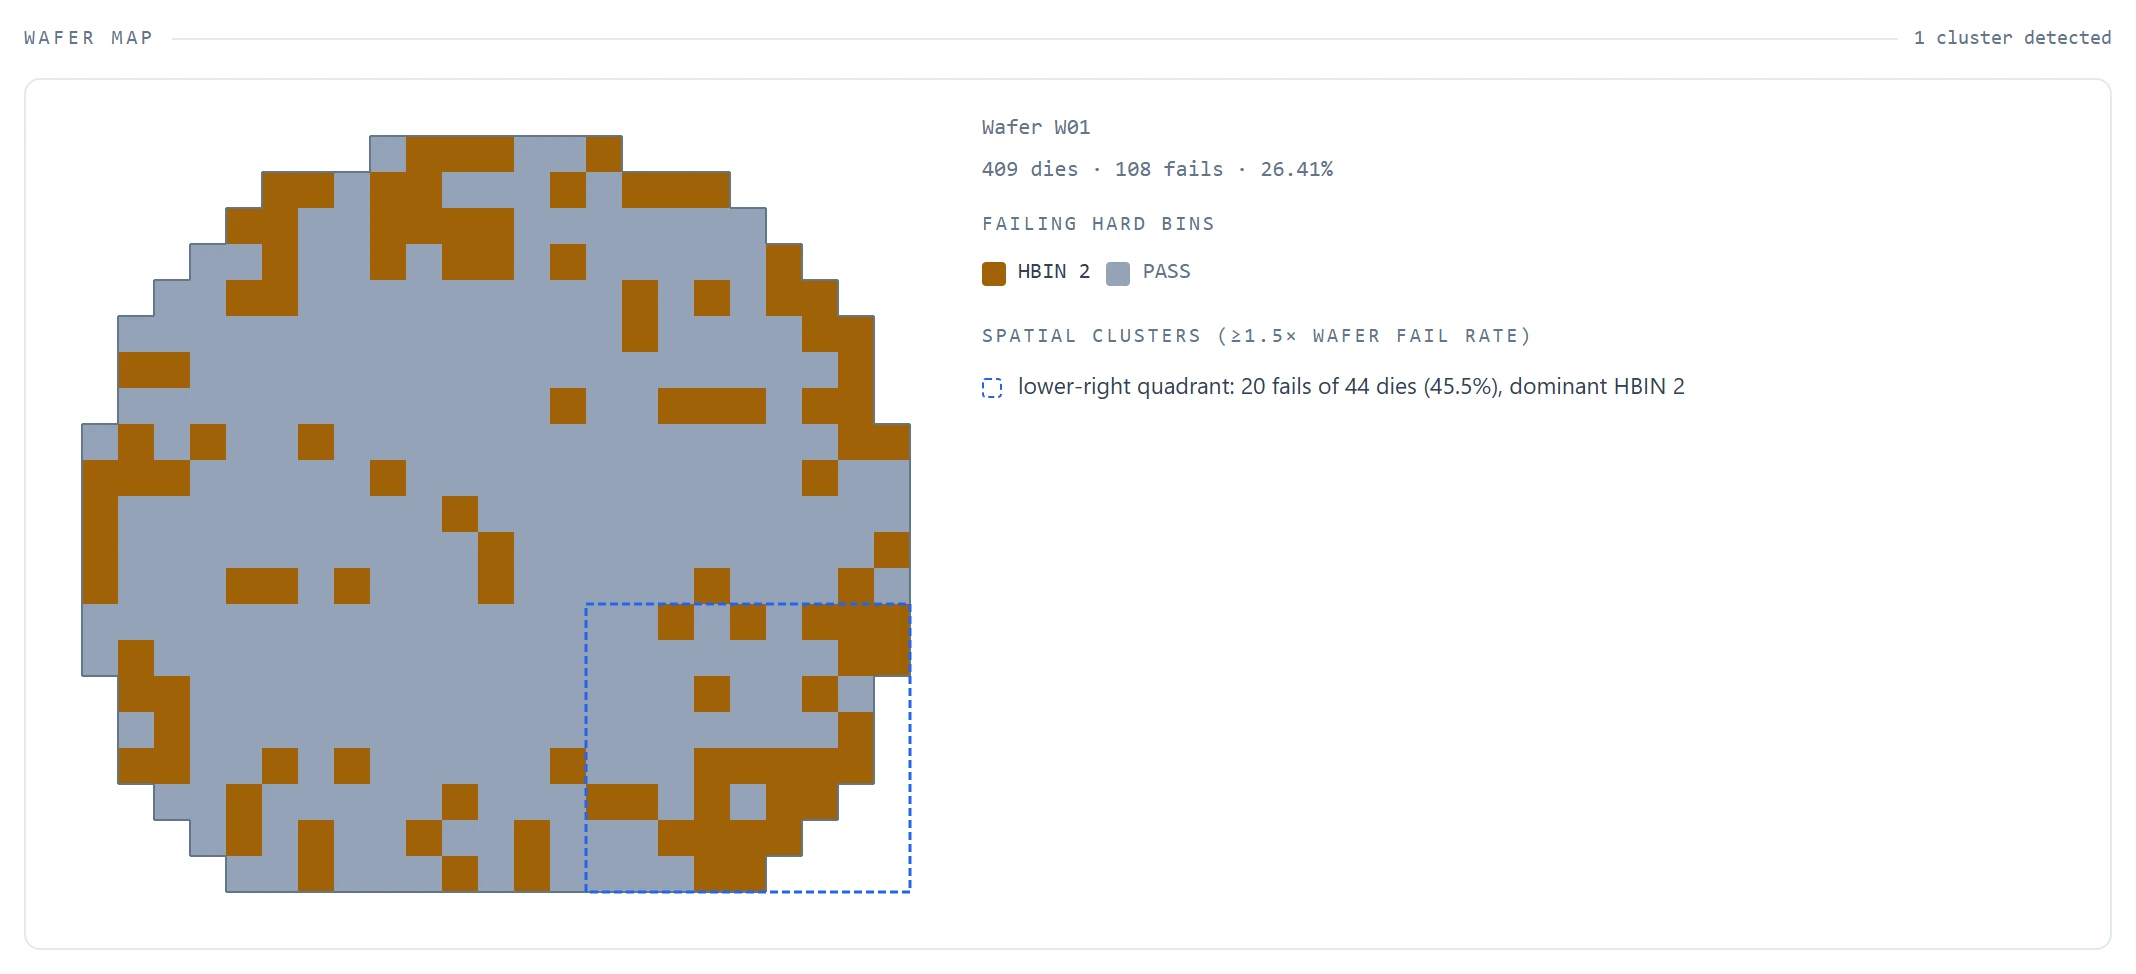
| Wafer maps | A die map per wafer with spatial-cluster detection; each cluster is named with its dominant bin. |
| Site ↔ socket overlay | Each test site mapped to its load-board socket, so a per-site yield skew is named against a socket rather than an abstract site number. |
| Limit proposals | A proposed program limit pair per parametric test, computed from the lot's statistics and clipped to the spec. Never written to the program (§06). |
Ask the IG-XL agent
The analyses are also tools the IG-XL agent calls — nine of them for STDF. Ask which test is gating yield, which passing parts sit outside the population, how a test has moved across lots, or whether a guard band reached production, and the agent works from the same deterministic tables the lot page shows. From the pane beside Excel, switch to Debug mode to reach them.
Lot detail
Opening a lot gives the working view a product engineer reaches for first: per-site yield, the hard-bin pareto, the top failing tests with pass rate and Cpk, the parametric grid with a histogram per test, the first-fail and test-time paretos, the outlier screen, and a limit-drift table that compares the limits the lot ran against the spec.


The site ↔ socket overlay names each test site's load-board socket, so a per-site skew like the one in Fig. 2 is read against the physical board rather than as a site number.
Wafer maps
Wafer-sort lots render as a die map with spatial-cluster detection. Each cluster is named with its dominant bin, and a region is marked only when its fail rate stands clearly above the wafer's overall rate. The detector marks where fails concentrate; the engineer decides what a cluster means.
Feeding statistics back to the program
Turn a lot into a proposed limit pair for every parametric test. The proposal is computed from the lot as mean ± 4σ, clipped so it never exceeds the spec, and classified: tighten the guard band, widen within the spec, no change, or insufficient data. A population that itself sits outside the spec is classified as a process that cannot support it — an engineering problem, not a limits change. The arithmetic is deterministic; no language model computes a limit.
Each proposal names which copy of the program its current limits came from — the live open workbook or an ingested snapshot — and it stays a proposal: the tool has no write path to the program. Apply a change in the workbook yourself, or have the IG-XL agent stage the edit and apply it from the agent window beside Excel or from ATE·IQ Chat, through the connected add-in. The same limits feed the traceability dashboard.
What the demonstration lots show
The demonstration project carries nine STDF V4 files — six wafers of one wafer-sort lot (409 dies each) and three final-test lots (480 parts each, 4 sites), 3,894 parts in all — read by the same parser a production file goes through. Four defects were planted — three in the lots and one in the spec. What is measured is whether the deterministic tools surface each one.
An edge signature fading. Wafer-sort yield climbs from 73.59 % on wafer 1 to 92.42 % on wafer 6 as the edge signature fades: the rim fail rate falls from 48.5 % to 6.8 % (Fig. 4).
A socket, not the device. Site 3's dip in the first final-test lot (Fig. 2) holds every input-leakage fail in that lot, and passing leakage there is about 14 times the other sites. The signal is gone in the next two lots.
A capability index that misleads. The normal-mode supply-current test is bimodal in all three final-test lots: a tight main mode, a second mode about 1.8 times higher, and an empty gap between them. In the latest lot it fails 29 times — 6 % of executions — while its Cpk reads 1.06 (Fig. 3). The outlier screen flags exactly the passing parts that sit in the second mode: 5, 9 and 5 across the three lots.
A guard band that never reached the program. The spec's upper limit on the power-down supply-current test was tightened by 20 % after the program was generated; the program's Flow limit and the limit every lot recorded stayed at the old value. The cross-pillar reconcile names it as the only compliance error across the 16 reconciled tests (“program looser than spec”), and across the three final-test lots 5 parts passed the program while sitting above the tightened spec limit.
Measured on the demonstration project. Lots are seeded synthetic data with planted defects.
.std.Z (LZW)
files are rejected with a clear error — decompress to .std first — and
statistics computed under an earlier version are not silently recomputed: re-ingest
the file to refresh them.